- Aug 17, 2025
What the Candlesticks or Price Bars Are Telling You in Swing Trading
- Brian Montes
- 0 comments
If you’ve ever opened a stock chart, you’ve seen candlesticks or price bars. At first glance, they might just look like green and red boxes with little lines sticking out of them. But here’s the truth: candlesticks are telling you a story.
They reveal the constant battle between buyers and sellers, momentum shifts, and even potential turning points in the market. For swing traders, learning to read candlesticks is like learning to read the market’s body language.
In this article, we’ll break down what candlesticks are really telling you — and how you can use them to improve your swing trading decisions.
What Candlesticks Represent
A candlestick (or price bar) captures four key pieces of information within a specific time period (for example, a daily candlestick shows what happened in one day of trading):
Open: The price at which the stock started trading.
Close: The price at which the stock finished trading.
High: The highest price reached during that period.
Low: The lowest price reached during that period.
The candlestick body (the thick part) shows the range between open and close, while the wicks (the thin lines) show the highs and lows.
👉 Why this matters: Together, these tell you whether buyers or sellers were in control during that period.
The Story Behind Each Candle
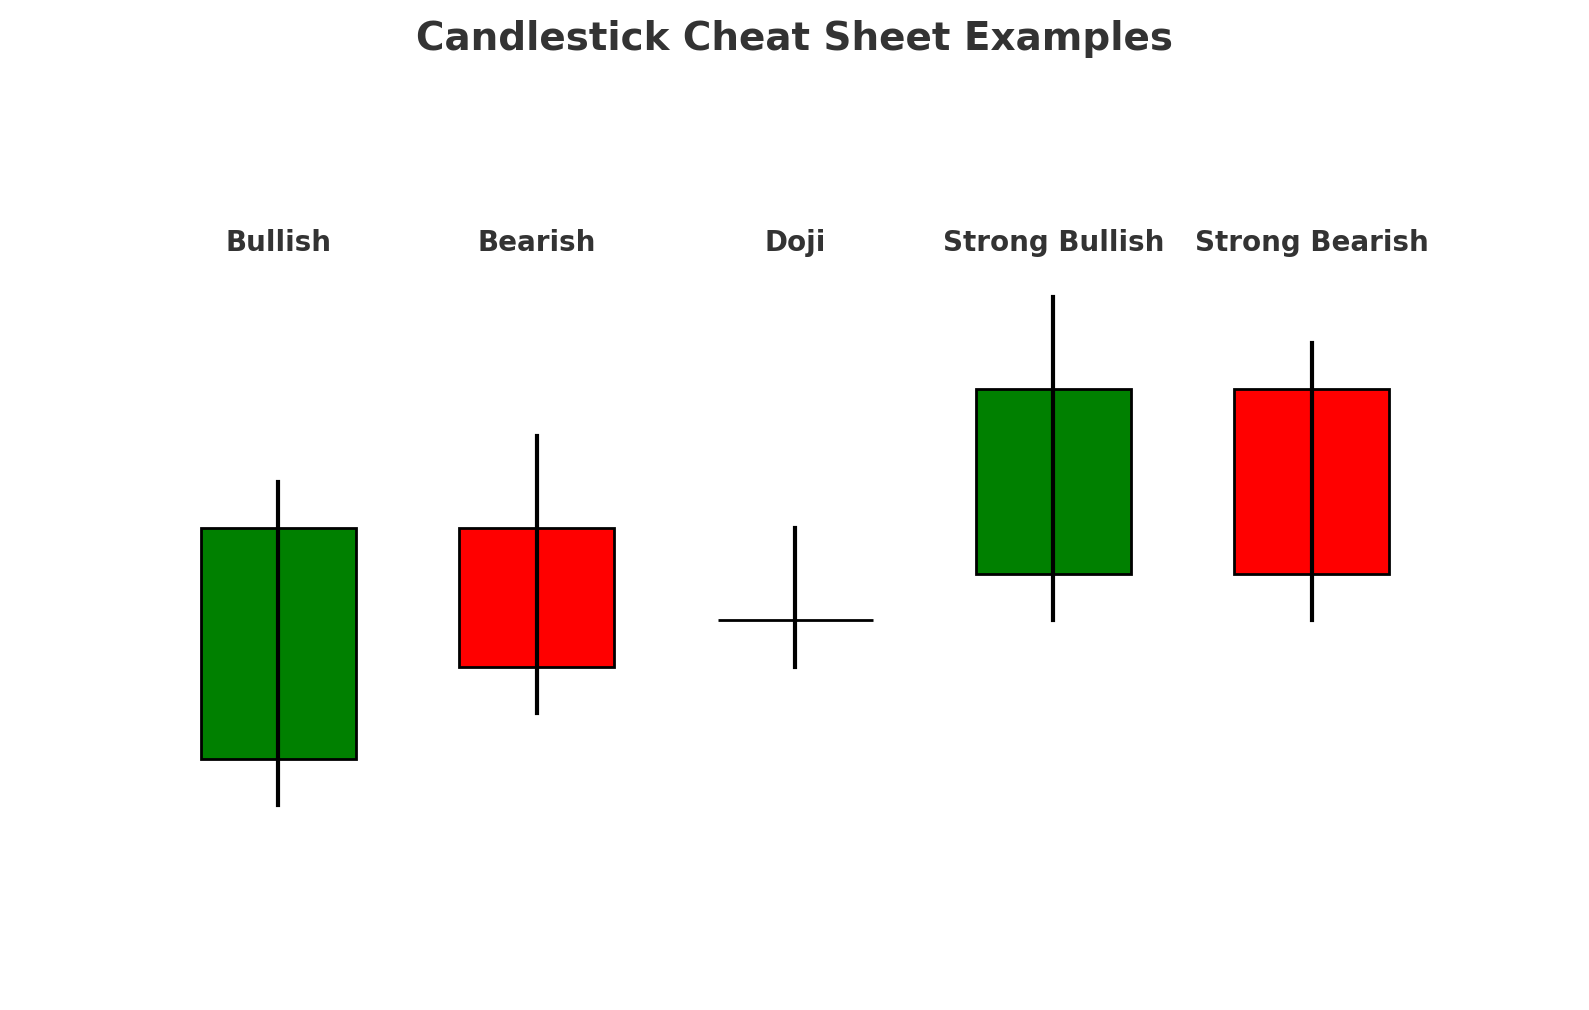
Think of each candle as a short story about the market. Here are some of the key messages candlesticks can reveal:
Strong Bullish Candle (large green body, little to no wick): Buyers were in control from start to finish.
Strong Bearish Candle (large red body, little to no wick): Sellers dominated the session.
Long Wicks on Top: Buyers pushed the price up, but sellers forced it back down — a possible sign of weakness.
Long Wicks on Bottom: Sellers drove the price down, but buyers stepped in and pushed it back up — a sign of buying strength.
Small Body (Doji or indecision candle): Neither buyers nor sellers had control — the market is undecided, which could lead to a big move.
Why Swing Traders Should Pay Attention
As a swing trader, your goal is to anticipate where the market is headed next. Candlesticks help you do exactly that:
They show momentum shifts before they appear in lagging indicators.
They highlight potential reversals when buyers or sellers start losing strength.
They confirm continuation patterns when the current trend remains strong.
For example, spotting a long lower wick near a support level could suggest buyers are stepping in — a clue that the stock may bounce higher.
Putting It Into Practice
Don’t worry about memorizing every single candlestick pattern you see online. Instead, focus on this:
Who’s in control — buyers or sellers?
Where is momentum shifting?
What clues are the wicks and closing prices giving you about future movement?
Once you start asking those questions, candlesticks will stop looking random — and start looking like clear signals.
Free Resource for Swing Traders
If you want to take this further, download the DTA A+ Swing Trading Checklist. It’s a simple tool to make sure you’re only taking high-probability trades — the kind that stack the odds in your favor.
DTA A+ Swing Trading Checklist
Final Thoughts
Candlesticks and price bars aren’t just colorful shapes on a chart — they’re the market’s way of communicating with you. By learning to read them, you’ll gain insight into the battle between buyers and sellers, spot momentum shifts early, and improve your timing as a swing trader.
Start paying attention to the story behind each candle, and soon, you’ll notice trading opportunities most people completely overlook.