- Jul 13, 2024
Bull Flag Pattern - How to Identify it and How to Trade It
- Brian Montes
- 0 comments
What is a Bull Flag Pattern?
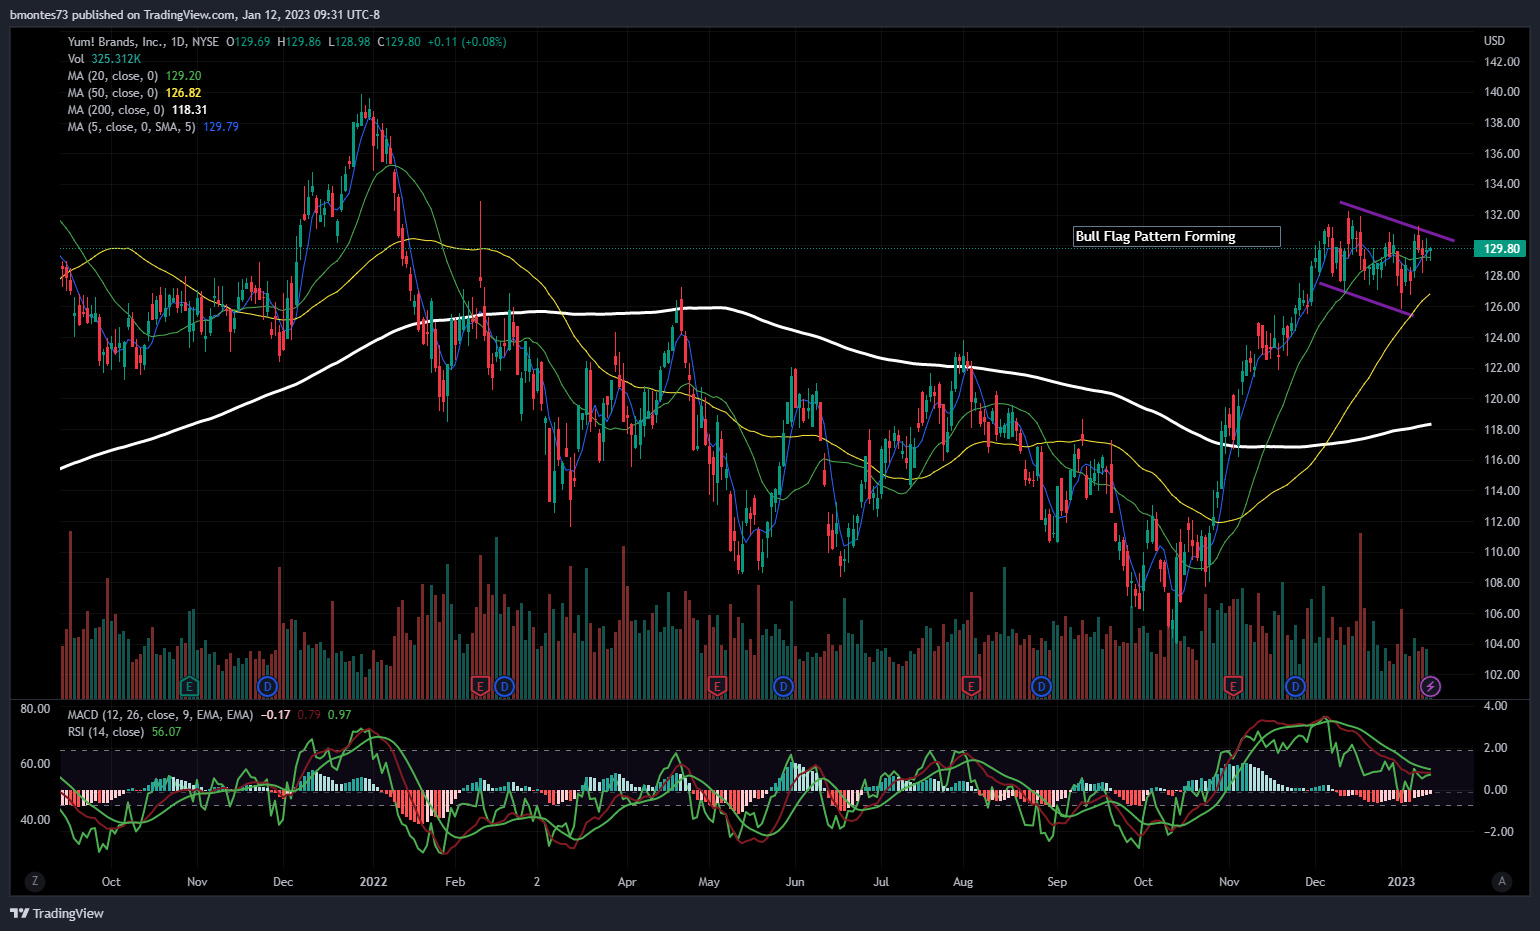
This is a continuation pattern within the field of technical analysis. It occurs within an uptrend and is characterized by a consolidation phase, represented by a small rectangular shape or a slight downward slope, followed by a breakout to the upside, resuming the upward trend.
The pattern resembles a flag on a flagpole, hence its name.
The pattern is formed when there is a sharp price increase, known as the flagpole, followed by a period of consolidation or mild retracement, forming the flag portion. This consolidation typically occurs as traders pause and consolidate their positions before the uptrend continues.
Bull Flag Properties
The Pole Size—This is the height of the flag. It is the percent change that happened before the flag formation started. A sharp and significant upward price movement should precede the consolidation phase.
The Flag Width - This is the time in days of the flag formation. The duration of the flag pattern can vary. Some flags may form over a few days, while others may take weeks or months. Traders typically monitor the price action within the flag to look for signs of a breakout or further consolidation.
How to Recognize a Bull Flag Pattern - A technical continuation pattern can be observed in stocks with strong uptrends. The pattern takes shape when the stock retraces by going sideways (or slowly declining) after an initial significant rise in price.
The bullish flag pattern consists of three essential parts:
The Run-Up Phase—In the first stage, buyers aggressively enter the market, increasing prices. These early buyers attract other buyers, creating an absolute buying frenzy (momentum).
-
The Consolidation Phase - After a while, the price settles down. This is happening because there are fewer and fewer buyers willing to buy shares. (potential buyers begin to view the stock as too extended).
Sellers also enter the market because they want to keep their profits. When all of this happens, the stock will enter the consolidation phase.
It will remain in this phase until (new) buyers or sellers enter the market and disrupt this equilibrium again.
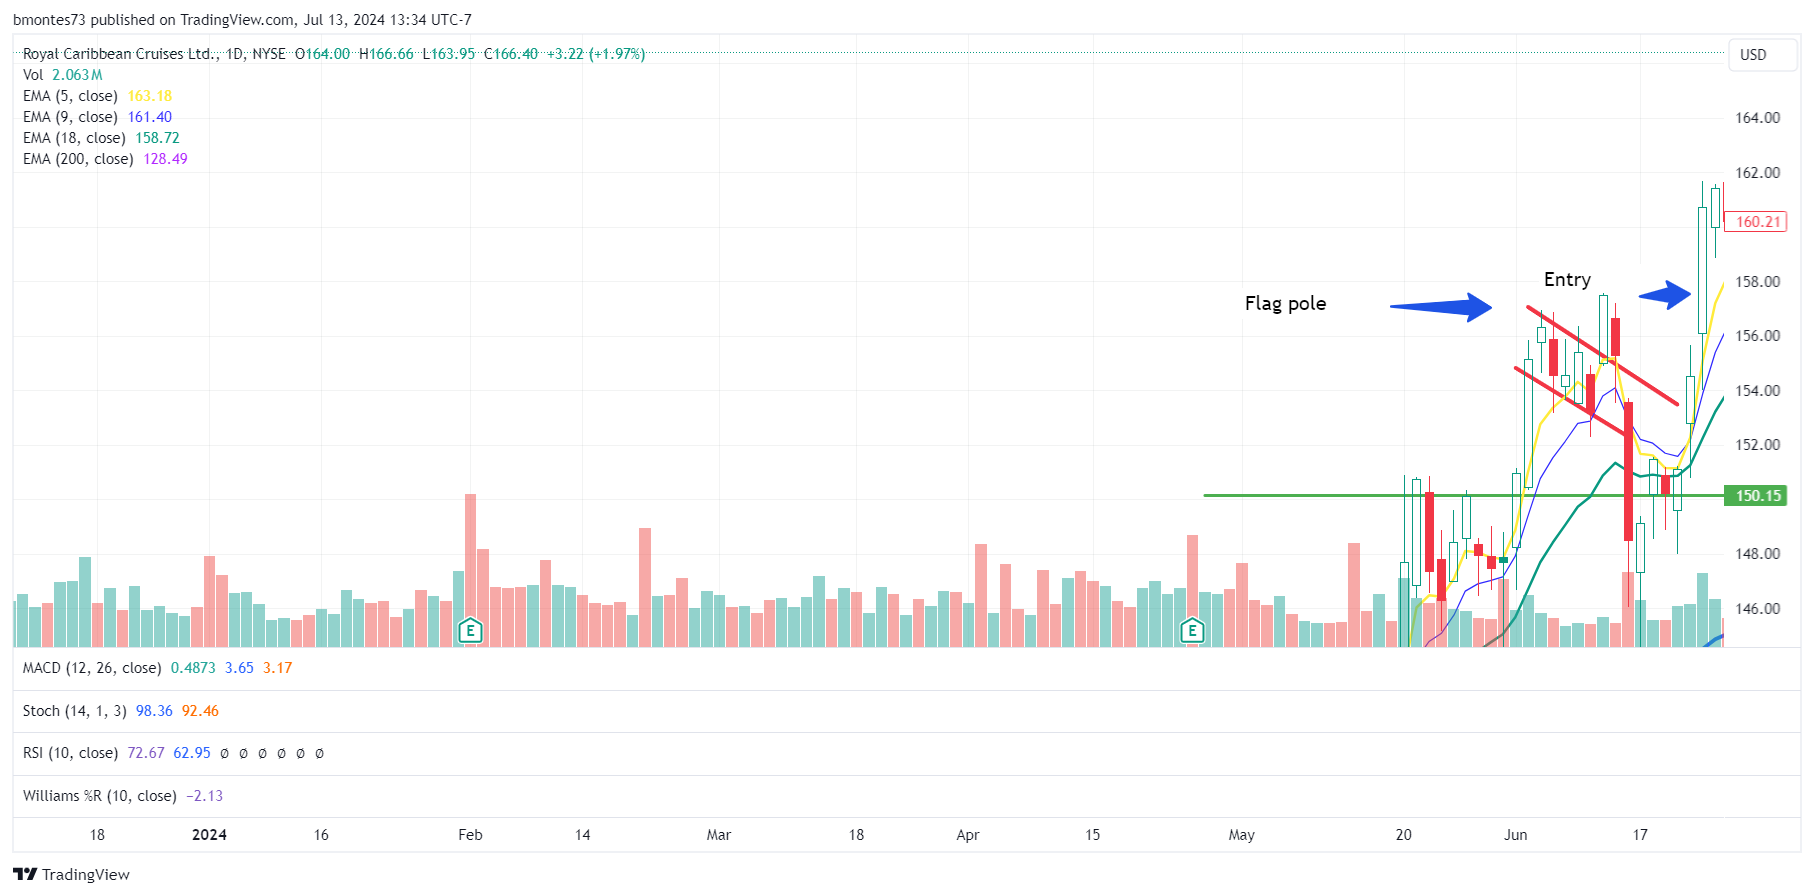
The Breakout—This is the final stage, a subsequent upward price movement breaking above the flag's upper boundary, signaling the continuation of the uptrend.
How to Trade the Bull Flag
If you want to trade this pattern, remember it is a continuation. So, we will use this pattern to take a long position. To do this, two conditions must first be met.
The price must rise above the descending trend line forming the flag pattern,
The closing price must be higher than the top of the formation.
Keep the following in mind before placing a trade:
The breakout must be evident: a long white candle closing higher than the highest price within the pattern up to that point.
The volume associated with the breakout is noticeably higher compared to previous trading days.
Buying occurs only when the breakout is definite. This is the only way to avoid false breakouts.
By default, the initial stop-loss is set below the bottom of the flag.
This strategy can be used by both swing and day traders because it is primarily based on positive momentum, the breakout from the flag pattern, and the associated volume.
I hope you enjoyed this post!